


Phase 4 / 2015 (January – December 2015)
Seismic Risk Evaluation
Phase Summary
The objective of the 2015 phase refers to the risk assessment at Bucharest city level, considering four urban seismic hazard scenarios. This objective logically continues that of the 2014 phase, which aimed to analyse urban vulnerability. The research focused on the two census periods of 2002 and 2011, in terms of both city infrastructure and population, but also at the built environment level.
The seismic hazard of Bucharest was measured using intensity data and PGA values registered for the 1977 and 1990 earthquakes. Additionally, the scenario of the maximum intensity possible earthquake Mw=7.8 (Marmureanu et al., 2010) was considered.
Table 1. PGA hazard for various return periods calculated for Bucharest (modified from Sokolov et al., 2004)
|
Area |
Return period (years) |
PGA (cm/s2) |
Source of data |
|
Bucharest |
100 |
240 |
Lungu et al., 2003 |
|
100 |
120-200 (180-310b) |
Sokolov et al., 2004 |
|
|
475 |
290 |
Mantyniemi et al., 2003 |
|
|
475 |
240-420a (360-600b) |
Sokolov et al., 2004 |
|
|
475 |
314 |
UTCB, 2003 |
|
|
|
|||
|
a Values may be overestimated, because the site response is considered to be linear during large earthquakes. b Mean+1 standard deviation amplitudes of site response were used. |
|||
Due to the measured hazard values being calculated precisely on certain points (in which there are seismic stations or points defining a grid), it was necessary to use interpolation algorithms integrated into GIS. The most suitable algorithms are those that do not substantially alter the values around the initial points, such as the Natural Neighbour or Inverse Distance Weighted (IDW).
Figure 1 shows the maximum seismic possible hazard map scenario for Bucharest.
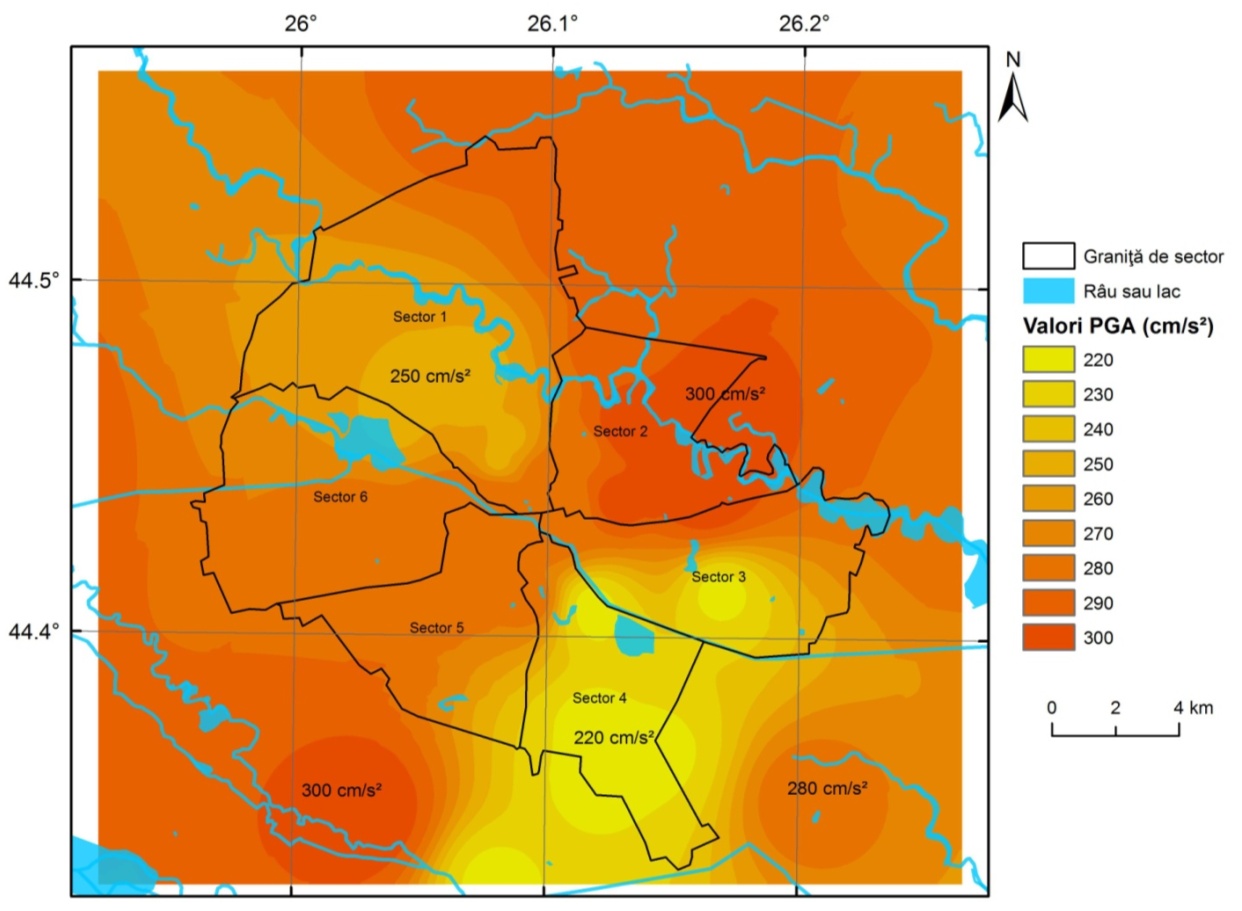
Fig. 1. The map of maximum acceleration (PGA) at Bucharest ground motion level for a maximum possible earthquake (Mw = 7.9) of intermediary depth in the Vrancea Zone (after Mărmureanu et al., 2010). GIS enables the representation and use of the raster values for the PGA.
1. Analysis of the seismic risk of transport networks
The transport networks have a clear spatial dimension and from the perspective of spatial analysis they represent a system with branches and crossing pipelines, roads, railways, aqueducts, power lines, which allow a certain flow of goods or vehicles. Based on scientific literature and local conditions, we analysed the risk of the Bucharest transport network as illustrated by the logical flow diagram in Figure 2.
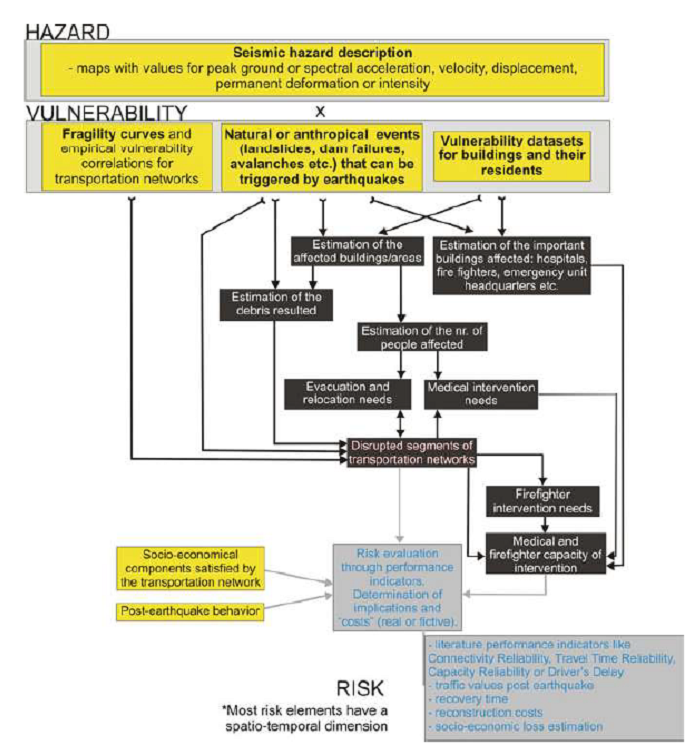
Fig 2. The logical flow diagram of elements and steps in the earthquake risk analysis of transport networks (Toma-Danila D., Armas I., Cioflan C.O. 2016)
The analysis of transport networks was based on a methodology specifically designed for this purpose by PhD student, Dragos Toma, in order to integrate free data provided by OpenStreetMap in the "Network Analyst" module of ESRI ArcInfo software.
The data on the road traffic values for Bucharest were obtained from a range of sources. One particular source of data was the authority dealing with road traffic measurements - the Centre for Road Technical Studies and Informatics (CESTRIN, www.cestrin.ro), which is a technical body of the National Company of Motorways and National Roads in Romania (CNADNR).
Another source of data was Google Traffic from 2012 (https://en.wikipedia.org/wiki/Google_Traffic). Because Google does not yet allow Google Traffic data downloading, we extracted data manually, using georeferencing, digitization and transcription of values.
The method used in the analysis of performance indicators for road networks in Bucharest was the cost-distance method, which is integrated into GIS software. The cost functions used are similar to Euclidean functions, but instead of calculating the distance from one point to another, they determine the shortest "viable" distance (or the cumulative cost of the trip) from one cell to another, from a set of cells close to each other.
In order to calculate trip costs for each cell, we used the following formula:
Cost per cell = cost attributed to each cell * cell spatial resolution
Calculation of travel time or costs (real or fictitious) between origin and destination points is a necessity when analyzing the implications of earthquakes, automating the process of calculation being a substantial advantage.
One of the optimum solutions is to use the specially designated Network Analyst module within ArcGIS. Once the network is defined according to the required specifications, this module allows routing and multi-routing solving problems, finding the nearest location (not necessarily calculated as distance). It also calculates the origin-destination matrix or determines functional service area zones. Figure 3 represents an example of automatic calculation of the optimal route between two points, given the importance of road travel. An estimated time of travel is obtained.

Fig. 3. Example of automatic calculation of the optimal route, taking into account the characteristics of the road network. On the right, there are the instructions and estimated time of travel.
We used ArcGIS Network Analyst module for the road, rail and metro networks or the gas and electricity transport networks in a complex analysis.
2 Analysis of the built environment
The analytical method used in this project for estimating buildings probability of being affected is the Improved - Displacement Coefficient Method (I-DCM), which was presented in the 2014 phase report. In the 2015 phase, we applied the method for both the 2002 and the most recent census data, providing comparisons at the level of the risk evolution of the building environment. In addition, the accuracy of data processing was verified by the quality of the results obtained, which maintained complex areal trends throughout the period 2002-2011.
The input data were:
- Data collected at 2002 and 2011 censuses - at the level of electoral voting constituencies;
- Complex data from 1999, prepared for SELENA and used in the evaluation system of the real-time damage caused by an earthquake in Romania - at the district level.
The structure of the data reported and provided by the Institute of Statistics for the 2011 Census, even though more relevant due to its actuality and improved resolution, was much more limited when compared to the structure of data sets from 1999. Because of this, it was necessary to find a method to combine all the statistical data sets using statistical calculation of probabilities for different building classes (Fig. 4).

Fig. 4 Scheme used for converting 2002 and 2011 census data to the SeisDaRo format and for obtaining building loss estimates (Toma, 2016)
In the 2015 Phase, we performed the risk analysis at the level of the built environment on four seismic scenarios: the 1977 earthquake with two alternatives, the 1990 earthquake and the maximum possible magnitude earthquake; Table 2 includes a data summary for buildings (and their limitations) at the level of the last two censuses. In order to overcome the limitations of the 2002 census data regarding the building material, we applied an empirical determination of each census unit specific profile. The profile of a census unit was identified as belonging to a class percentage. For example in a particular unit with 200 buildings classified as low and built before the introduction of seismic codes, there is a 20% probability that the buildings belong to the RC class, 50% to the M3_1 class and 30% to the M2 class (according to the international classifications and the vulnerability graphs presented in the 2014 Report).
Table 2. General data on buildings
|
2002 census units |
2011 census units |
|
112039 buildings in total |
131875 buildings in total |
|
154 census units |
128 census units |
|
Data at the level of census unit |
Data at the level of census unit |
|
The building period: <1940, 1940-1959, 1960-1989, 1990-2002 (years) At the level of building period: height of the building: <2S, 2-4S, 5-7S, 8-10S,>10S (floors)
There is no missing/unclassified data |
The building period: <1919, 1919-1945, 1946-1960, 1961-1989, 1990-2002, 2003-2011 (years) At the level of building period: height of the building: <2S, 2-4S, 5-7S, 8-10S,>10S (floors)
40000 buildings in undefined classes |
|
There is no data regarding the building material |
Building material conform to international classification: Reinforced Concrete, Precast Concrete, Masonry with concrete floor, Masonry with wooden floor, Wood, Adobe, Other materials, Composite materials
20156 buildings in undefined classes |
At each census unit level, we introduced in the calculus specific vulnerability graph values for areas occupied by blocks or houses.
3 Risk analysis at the level of population
To evidence the risk at the population level, a quantitative risk method, based on the formula = Hazard x Vulnerability x total number of people in dwellings (and exposed) was applied. The scale of analysis was at the census unit level. The scenarios were run both on 2002 and 2011 Census data, the comparative results are currently awaiting publication.
The 2015 phase was focused on creating a complex index of Social Vulnerability, based on the classic methodology developed by Cutter et al. in 2003, but also based on a weighted index, identified through a methodology presented in detail in the Armaș and Gavriș paper published in 2013. Variables choice was limited by the census data with many missing values in the 2011 Census data, especially affected by the inability of obtaining measures for economic indicators. The spatial clustering of social vulnerability was explored with GeoDa (Anselin, Syabri, and Kho 2006) software, and the obtained results statistical signification was tested with LISA.
Results on social vulnerability at the 2011 census data were presented at the EcoSmart International Conference, and published in the ISI indexed Environmental Sciences Proceedings.
Social vulnerability results were introduced in the formula: hazard (the maps of seismic intensity for the four scenarios with a certain probability of recurrence in time) X social vulnerability (2002 and 2011) x the weight of severely damaged buildings in each ward (constituency) x number of people on dwellings (2002 and 2011). Results showed both, the annual probability of the maximum possible number of people being harmed in the case of an earthquake within a period of recurrence presupposing a certain intensity, and the maximum percentage by constituencies (wards) of those likely to be affected (injured / victims).